When budget pressure arrives, cleaning is often the first line item cut. It feels like a safe place to find savings: reduce frequencies, consolidate scopes, extend the contract renewal cycle. The building still looks decent. No one complains immediately. Then, 18 months later, the real invoice arrives in the form of premature floor replacement, a slip-and-fall settlement, and three anchor tenants who quietly chose not to renew.
Continue reading to see what that invoice actually looks like, and what a structured, KPI-driven cleaning program costs by comparison.
UG2 works with commercial and corporate real estate owners and property managers to build cleaning programs that function as asset protection strategies, not just line-item expenses.
Evaluate Your Building’s Risk Exposure
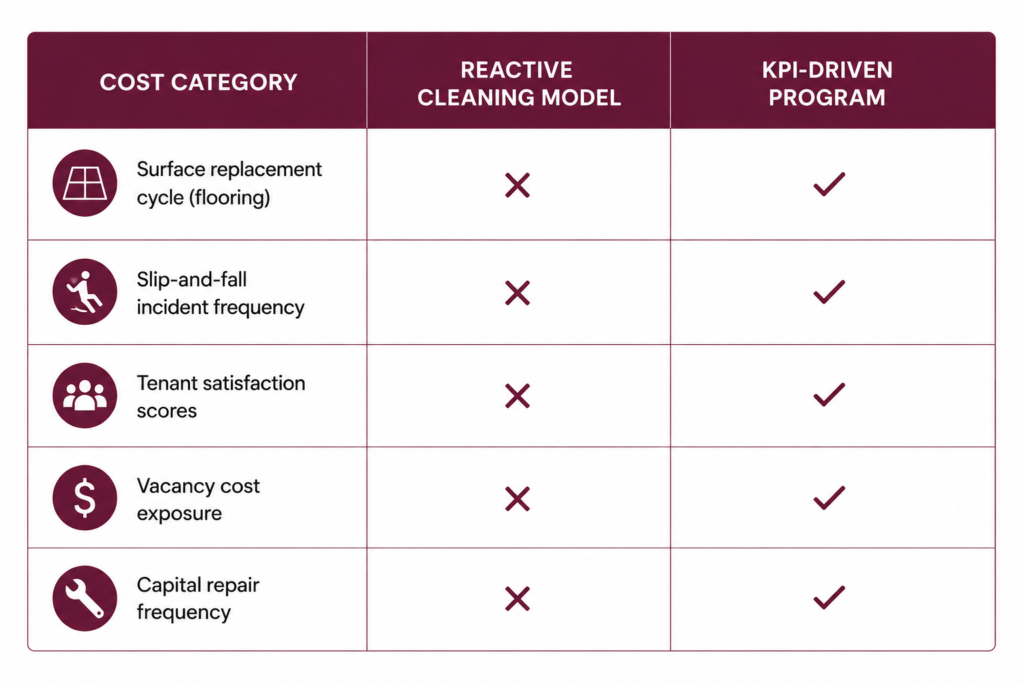
Reactive Cleaning vs. Structured KPI Programs: The Core Cost Model
The reactive cleaning model operates on complaint resolution. Typically, when an area gets dirty enough for someone to report it, then the cleaning service responds accordingly. This approach feels economical because it appears to match spend to demand. In practice, it systematically under-invests in prevention while accumulating exponential remediation costs.
A structured KPI program operates differently. It sets measurable standards by zone, tracks compliance through regular inspection cycles, and ties service levels to documented outcomes rather than complaints. The spend is more consistent, and the cost trajectory bends sharply downward over a three-to-five year building management horizon.
If your property is already in reactive mode and you’re evaluating a facility services provider change, the 90-day stabilization framework outlines how to make that transition without disrupting operations
For a deeper look at how commercial building service programs are structured to align with asset protection goals, UG2’s commercial janitorial solutions work across portfolio types to design programs that hold up against real financial modeling.
Surface Degradation: The Compounding Cost You Might Be Underestimating
Hard flooring is the most visible and most expensive surface category in a multi-tenant office building. In lobbies and high-traffic corridors, natural stone, polished concrete, and luxury vinyl tile all require specific maintenance protocols to hold their finish. When those protocols are deferred, the degradation is not linear. It accelerates.
Scratches and micro-abrasions from grit that were not removed become channels that hold soil, then stain. Grout lines that were not periodically deep-cleaned reach a condition where no routine cleaning restores them. Stone that missed its scheduled sealing cycle begins to absorb spills at a molecular level. Each of these conditions advances the replacement timeline by months, then years.
Floor replacement in a Class A commercial property can run $12 to $40 per square foot installed, depending on material and scope. A structured maintenance program that extends replacement life by three to five years on a 10,000-square-foot ground floor represents $120,000 to $400,000 in deferred capital expenditure. The janitorial cleaning program that achieves this costs a fraction of that annually.
Beyond flooring, restroom fixtures, elevator cab interiors, and glass curtain wall surfaces all follow the same compounding degradation curve when cleaning frequencies and protocols are not maintained. The cost is not visible in the annual budget. It appears in the capital reserve study.
Explore how UG2 structures facility services programs across industries to understand how surface lifecycle planning integrates with day-to-day cleaning operations.
Slip-and-Fall Risk: The Liability Multiplier Hidden in Deferred Protocols
Building owners and operators consistently underestimate the liability exposure that accumulates in a reactive cleaning environment. The financial model for a single slip-and-fall incident is straightforward and sobering.
Average slip-and-fall settlements in commercial property cases frequently exceed $40,000 to $60,000, and cases that proceed to trial carry significantly higher exposure. Legal defense costs add another layer regardless of outcome. Insurance premiums respond to claims history, often with compounding effects over the policy renewal cycle. And the operational disruption of managing a claim against active litigation, including employee time, documentation retrieval, and deposition preparation, has a real cost that rarely appears in loss models.
The more important number is the frequency driver. Slip-and-fall incidents in commercial buildings cluster around predictable conditions: wet floors without signage, debris accumulation at building entries during weather events, spill response delays in food service areas and break rooms, and deteriorated matting that curls at the edges and becomes a trip hazard. All of these conditions are directly addressed by a structured cleaning program with documented response time standards and hazard protocols.
A reactive model has no mechanism to address these conditions until after an incident. A KPI program treats hazard prevention as a measurable outcome with assigned accountability.
If you oversee corporate real estate facilities, the intersection of liability management and cleaning program design is a conversation worth having with your service provider before a claim makes it unavoidable.
Tenant Dissatisfaction: Mapping the Impact to NOI
Tenant satisfaction with building operations is not a soft metric. It connects directly to net operating income (NOI) through a chain of financial events that is well documented in commercial real estate.
Here is how the chain works: It starts when cleaning quality slips below the threshold tenants associate with a building of their lease tier. Next, initial complaints go to property management. Then, iff the response is inconsistent or the underlying service does not improve, the complaints become background dissatisfaction that tenants absorb into their overall building experience. Therefore, when lease renewal conversations begin, this dissatisfaction becomes negotiating leverage or, more damaging, a quiet decision to explore options elsewhere without ever escalating formally.
The cost of a non-renewal in a multi-tenant office building is not simply the gap between the departing tenant’s rent and the new tenant’s rent. It includes the leasing commission on the new transaction (typically 4 to 6 percent of total lease value), the tenant improvement allowance required to bring the space to market standard for the new occupant, the carrying cost of the vacant period during which the space generates no revenue, and the legal and administrative costs of executing a new lease. In aggregate, a single non-renewal in a mid-sized multi-tenant building can represent 18 to 24 months of equivalent rent in total transaction and downtime cost.
When a tenant’s decision not to renew is traceable in part to building quality dissatisfaction, the janitorial cleaning program budget that was reduced to generate savings has effectively produced a much larger loss. The math rarely looks different in the post-mortem.
The vacancy multiplier compounds this further in buildings where a non-renewal triggers tour activity from prospective tenants who observe current conditions and factor them into their decision. A building that has deferred cleaning investment is visible to anyone who walks the space during a prospective property tour. First impressions in commercial leasing have a documented impact on deal velocity and achievable rate.
Cleaning as Asset Protection: The Strategic Reframe
The most durable way to understand janitorial cleaning program investment is to remove it from the operating expense conversation entirely and place it alongside preventive maintenance and capital reserve planning. Cleaning is the highest-frequency systematic touchpoint for every surface, fixture, and common area in the building. No other service category touches the asset more often.
This frequency creates a structural advantage for buildings whose facility cleaning programs are designed to capture it. Trained cleaning staff operating under a KPI framework become the building’s first line of defect detection. A water stain appearing under a restroom door, a ceiling tile with a new discoloration, a grout line beginning to lift, an elevator door seal starting to fray: all of these are visible to janitorial cleaning staff before they are visible to any other service function. A structured program captures these observations, routes them to the appropriate maintenance function, and documents the detection and response in a way that supports asset valuation and due diligence.
A reactive cleaning model has no mechanism to capture this value. Janitorial staff are tasked with completing a scope as quickly as possible, with no inspection protocol and no documentation requirement. The early-stage damage accumulates invisibly until it crosses into visible defect territory, which is also the point at which remediation becomes substantially more expensive.
Learn more about how UG2 approaches facility services as an integrated discipline, not a commodity contract. The distinction matters when you are modeling a building’s long-term cost structure.
Building Your Risk Exposure Model: A Practical Framework
For building owners and asset managers who want to evaluate where they sit on the risk exposure spectrum, the following framework provides a starting point.
Begin with your current facility cleaning spend per square foot and compare it against the published benchmarks for your building class and geographic market. Significant deviation below benchmark is a leading indicator of deferred investment, not operational efficiency. Then model your floor replacement timeline against manufacturer-recommended maintenance protocols. If your current program does not include the specified maintenance scope, your replacement timeline is almost certainly shorter than your capital reserve plan assumes.
Next, pull your trailing 24-month incident log for the building. Any slip-and-fall or trip-and-fall incident that occurred in a location where janitorial cleaning response time or hazard protocol was a contributing factor should be tagged and modeled against the cost of the KPI program elements that would have addressed the condition. In most buildings, two or three incidents produce a compelling financial case on their own.
Finally, survey your tenant base directly on facility satisfaction. If you do not currently have a formal mechanism for capturing this data, the absence itself is a missed opportunity. Buildings operating under structured KPI programs have this data as a matter of course because it is a program output, not an occasional survey initiative.
The commercial facility services team at UG2 works through this kind of analysis with building owners and managers as a precursor to program design. The goal is not to provide the least expensive scope. The goal is to build a program whose cost is defensible against the full financial model, not just the line item.
Ready to move from reactive cleaning to a program that functions as asset protection? UG2 partners with multi-tenant office buildings to design KPI-driven cleaning programs that are measurable, accountable, and built to hold up against real financial modeling.
Evaluate Your Building’s Risk Exposure
Corporate Facilities | Commercial Buildings | All Industries
Explore UG2’s Facility Services by Property Type
- Corporate Facilities and Headquarters
- Commercial Office Buildings and Mixed-Use Properties
- Full Industry Service Portfolio
- About UG2: Approach and Leadership
- Contact UG2 to Discuss Your Building’s Program
Frequently Asked Questions
What is deferred cleaning and why is it a financial risk for building owners?
Deferred cleaning means reducing facility cleaning frequency or scope in response to budget pressure, typically with the expectation that standards can be restored later without lasting consequence. The financial risk is that the consequences are not reversible on the same timeline they accumulate. Surfaces degrade according to a compounding curve, liability exposure grows with each unremediated hazard, and tenant satisfaction erodes gradually until lease non-renewals produce a loss that exceeds the original savings by a wide margin. The damage is often invisible in the year it occurs and expensive in the year it must be addressed.
How do I calculate the cost difference between reactive and KPI-driven cleaning?
Start with three inputs: your current spend per square foot benchmarked against market rate, your floor and fixture replacement timelines compared against manufacturer maintenance requirements, and your trailing 24-month incident history. Model the cost of one slip-and-fall incident including settlement, legal defense, and premium impact. Then model the cost of one tenant non-renewal including leasing commission, tenant improvement allowance, and vacancy carrying cost. Compare those totals against the incremental cost of moving from a reactive to a proactive KPI-driven program. In most multi-tenant office buildings, the model closes within the first 18 to 24 months.
What cleaning KPIs should multi-tenant office buildings track?
The most operationally useful KPIs are inspection pass rates by zone on a defined frequency, tenant satisfaction scores captured through a formal feedback mechanism, incident and near-miss tracking with root cause documentation, surface condition ratings on a replacement cycle calendar, consumable restocking compliance in restrooms and common areas, and service request response time. A mature janitorial program benchmarks all of these monthly and uses the data to drive service level adjustments and contract accountability conversations.
How does cleaning quality affect tenant retention in multi-tenant office buildings?
Facility quality consistently ranks among the top factors in commercial lease renewal decisions, alongside rent rate and location. When cleaning standards decline, tenant experience degrades in ways that are highly visible during the daily occupant experience even if they are not always formally reported. By the time a non-renewal decision has been made, the dissatisfaction has typically been building for 12 months or more. The connection between janitorial cleaning investment and retention rate is measurable, and buildings that track both tend to find the relationship is stronger than their initial assumptions.
Can a cleaning program function as an asset protection strategy?
Yes, and framing it this way changes how building owners evaluate program investment. Cleaning staff make contact with every surface and common area in the building at a higher frequency than any other service function. A structured program with an inspection component turns that frequency into an early detection system for water intrusion, HVAC performance issues, physical damage, and surface degradation. This reduces the cost of repairs by catching conditions earlier, creates a documented maintenance history that supports asset valuation, and produces a defensible record of due diligence that matters in liability and transaction contexts.